| About station Hustopeče | |
| Overview | |
| Text output | |
| Graphic output | |
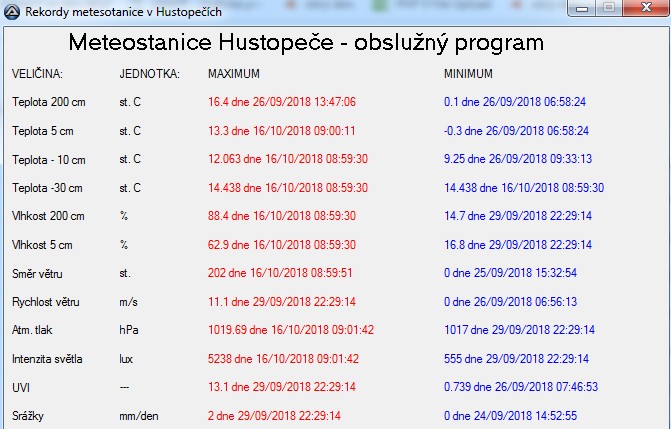
| Records | |
|
|
|
| Meteostation Hustopeče | |
| Meteostation Dubňany | |
|
|
|
| Puzzle game | |
|
|
|
| My-orto s.r.o. | |
|
|
|
|
|
|
Meteostation in Hustopeče
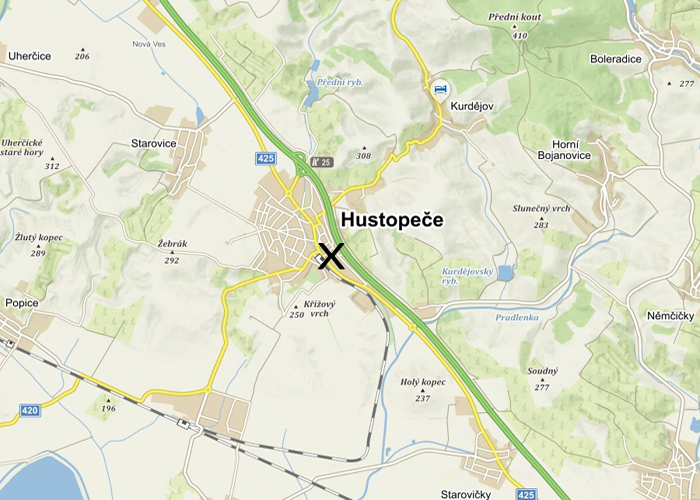
Location of the meteostation:
The station is located in Hustopeče, PBřeclav district, on the garden.GPS coordinates: 48.9380467N, 16.7393381E
Elevation of the meteostation is 196 m AMSL
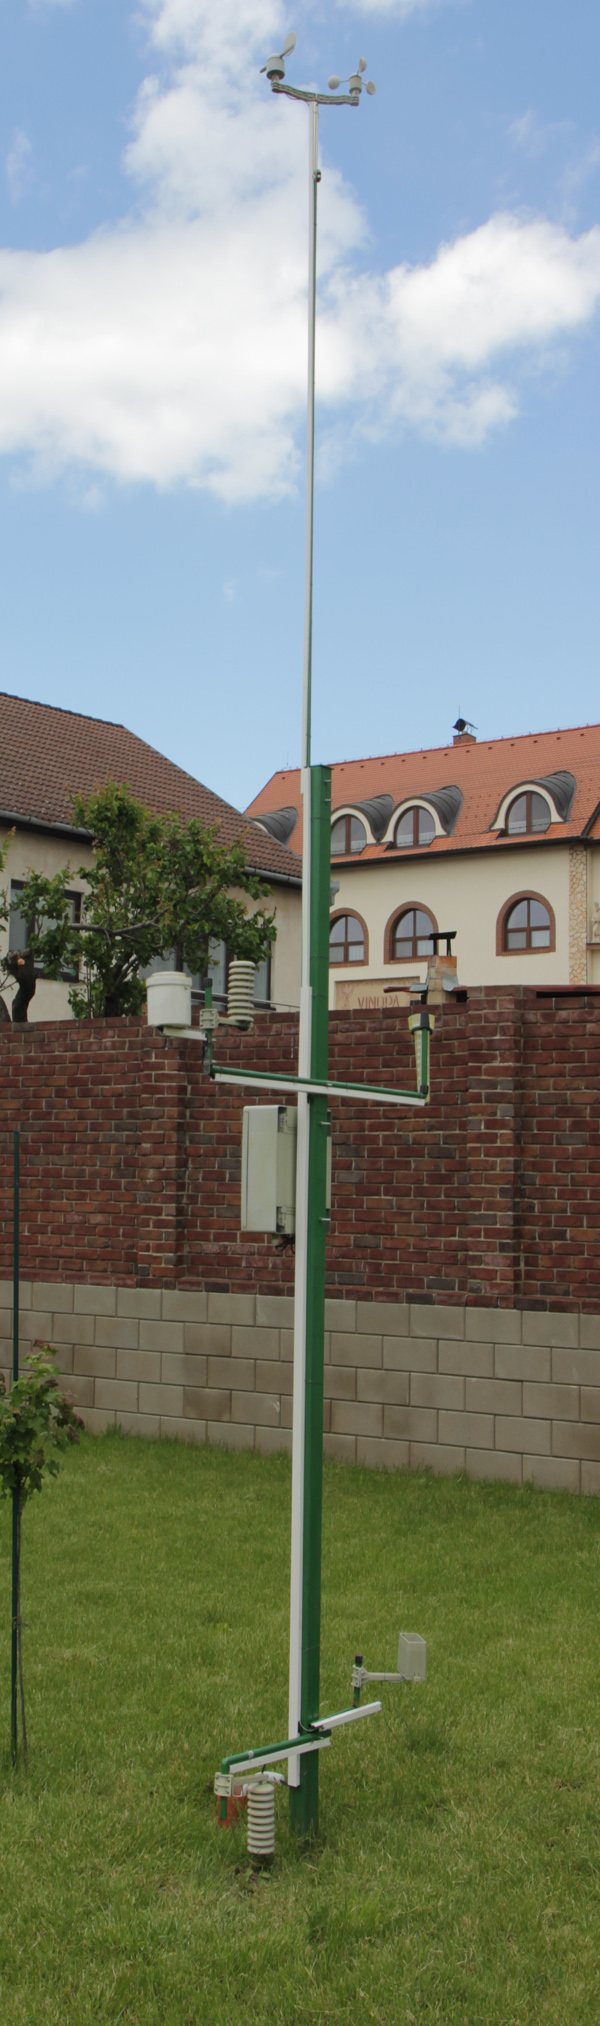
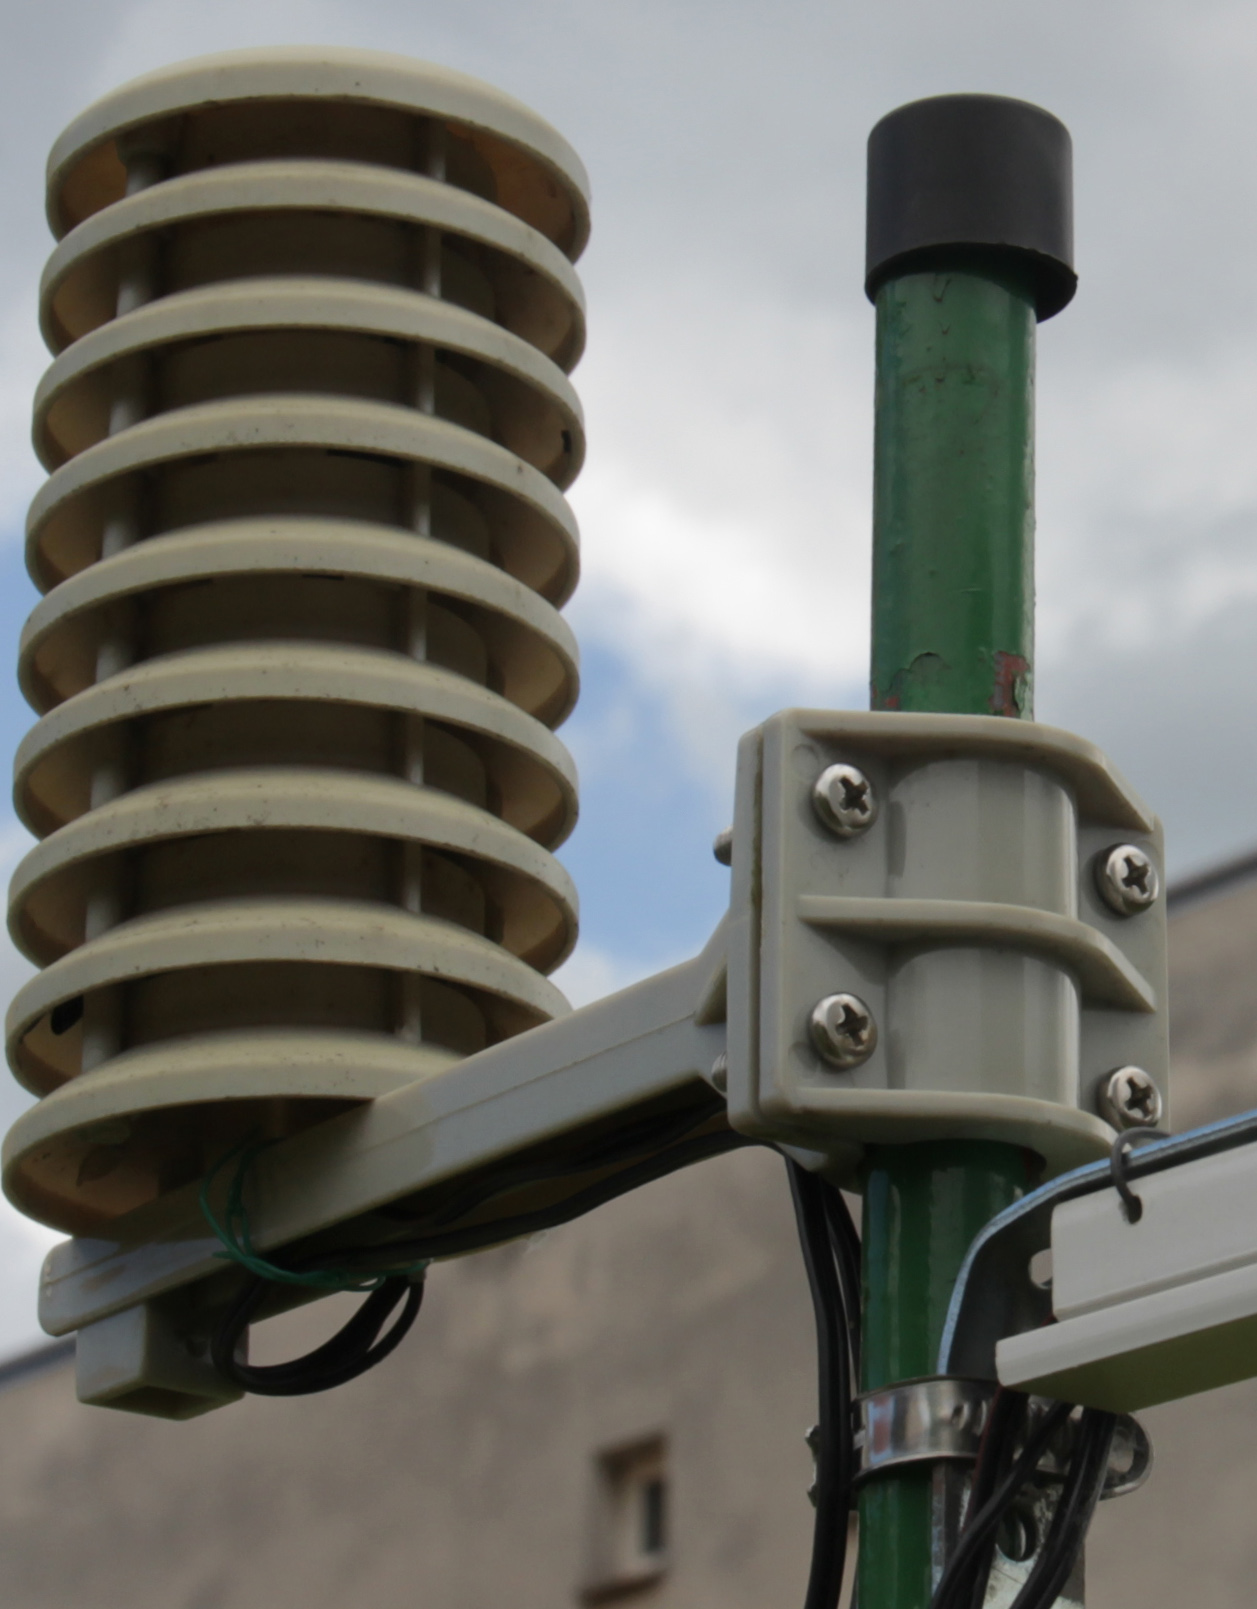
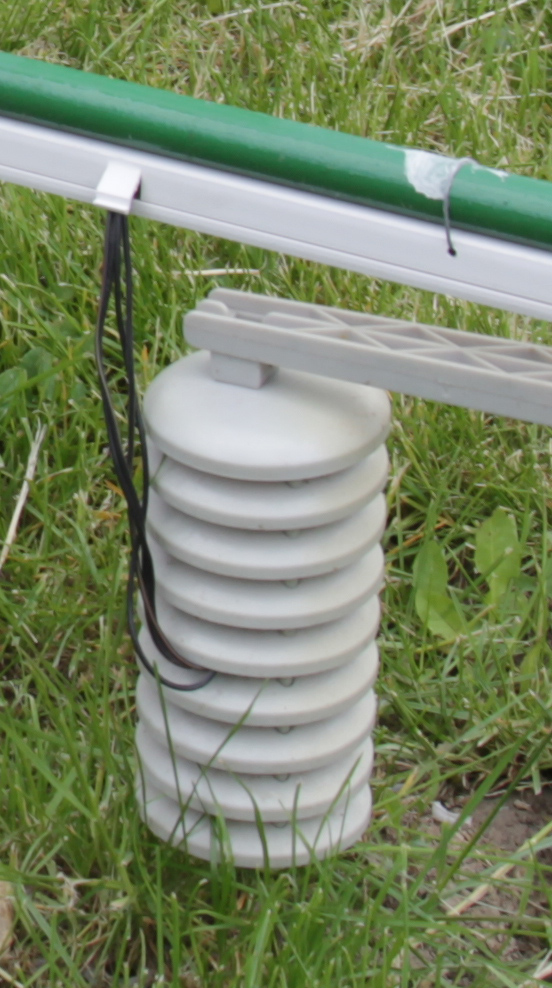
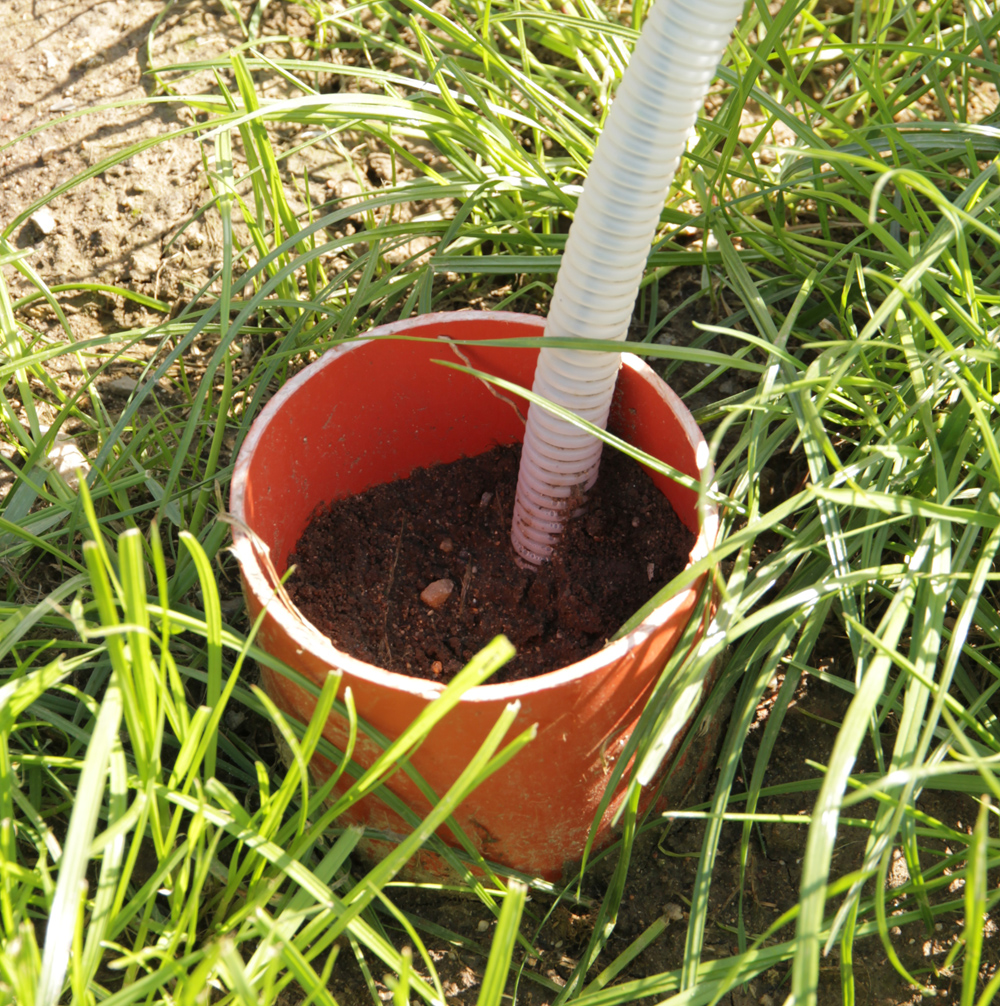
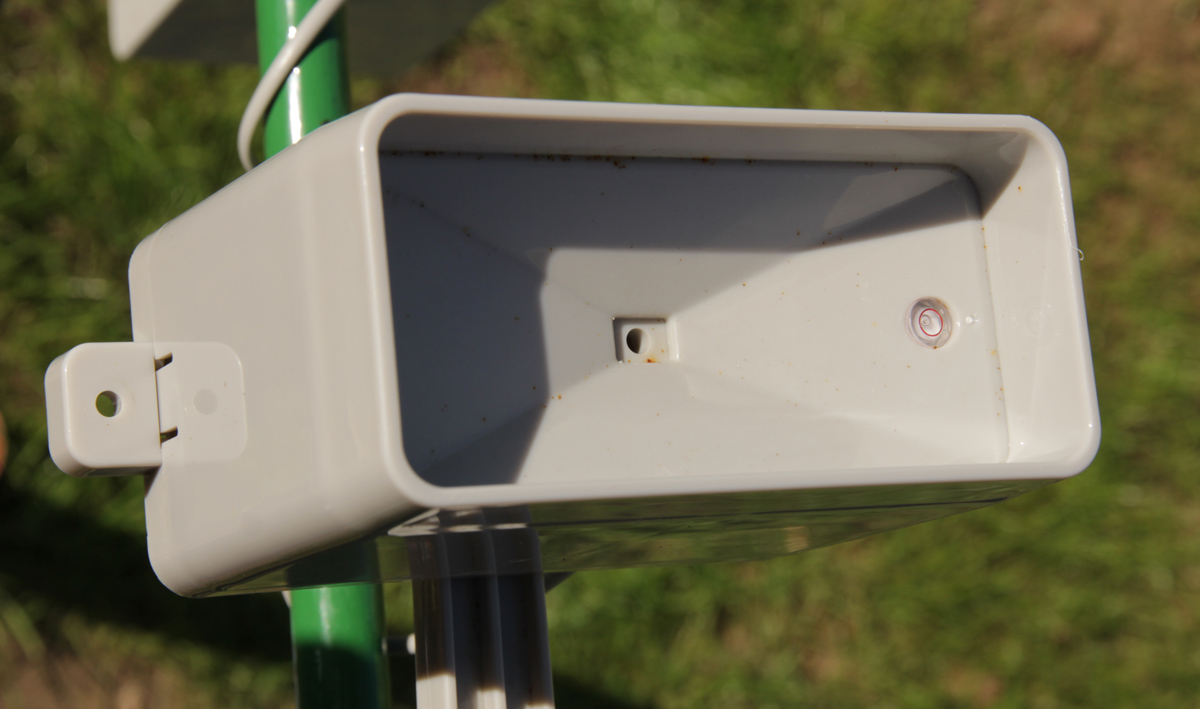
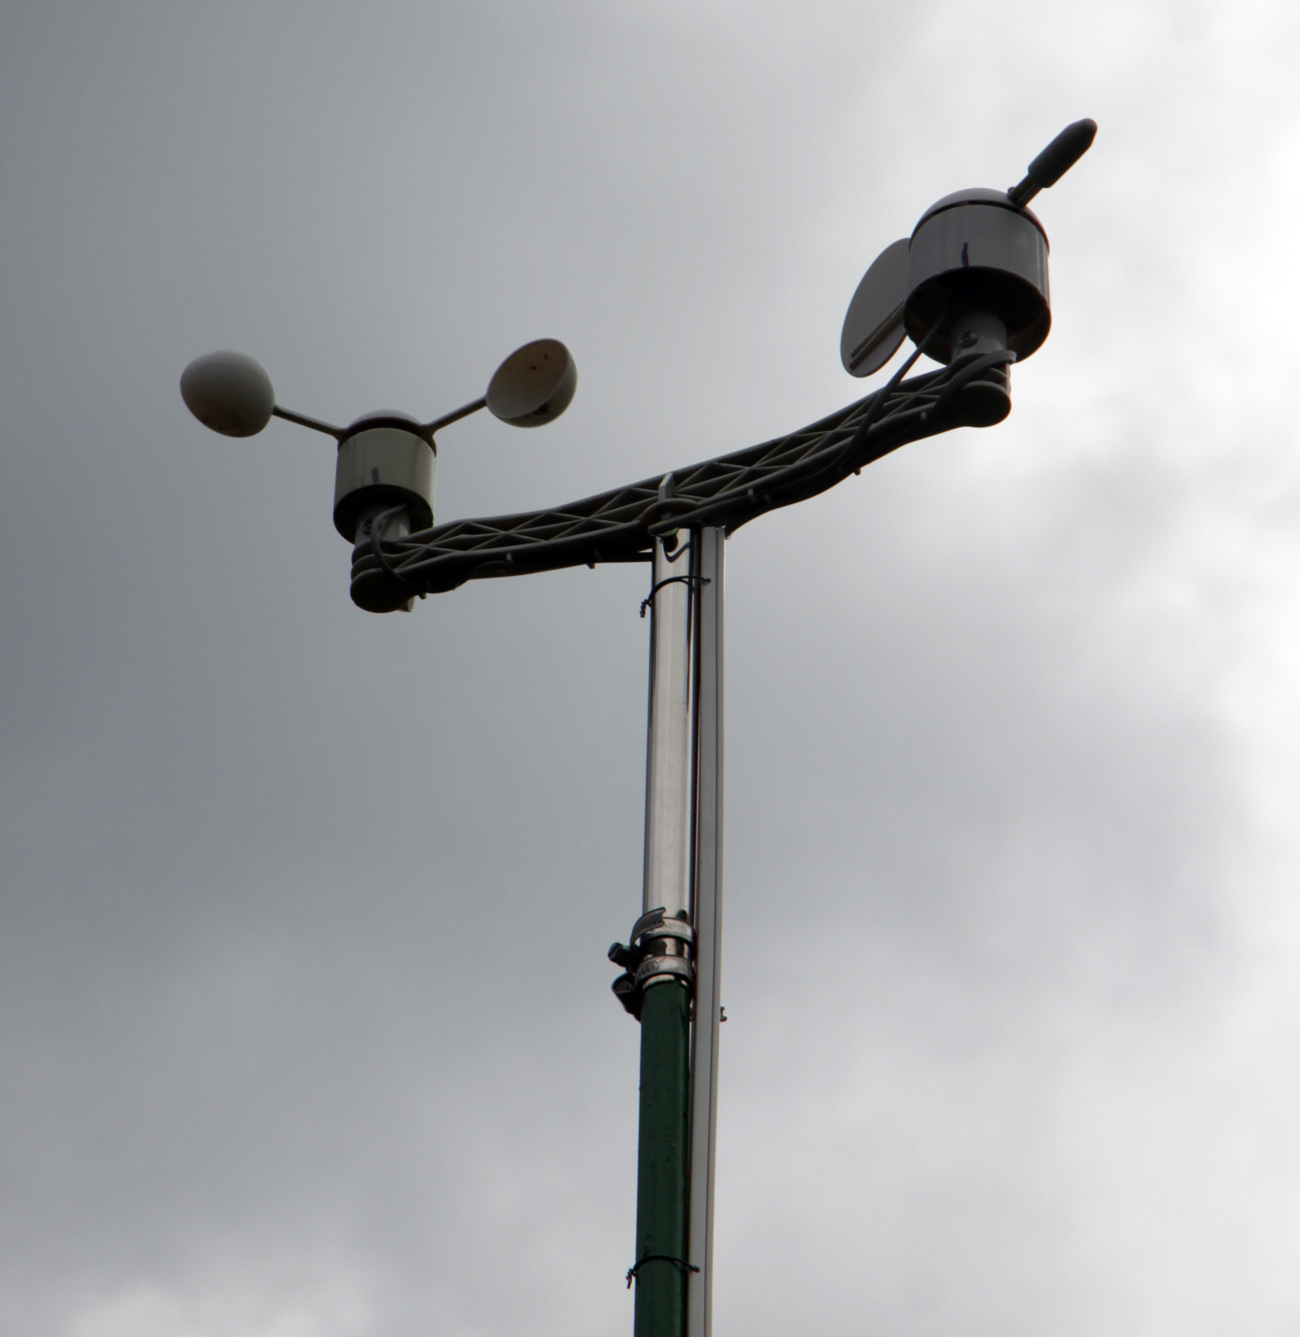
Construction and structure of the station:
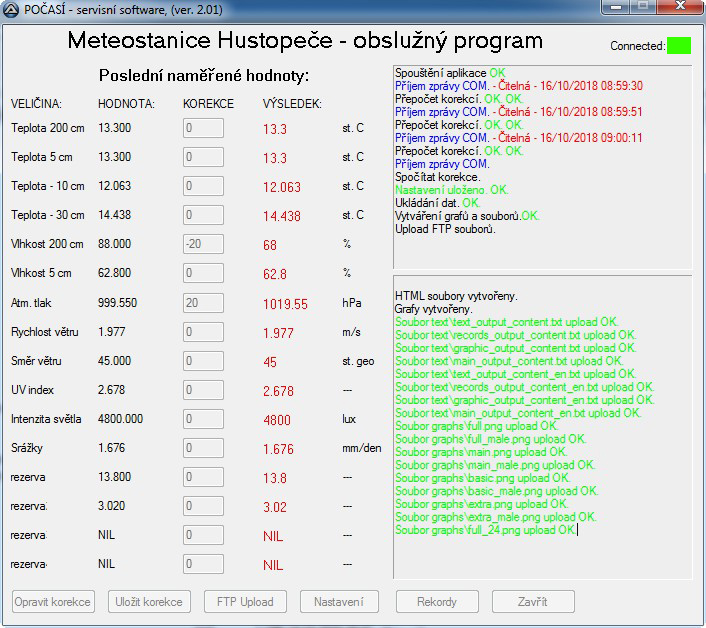
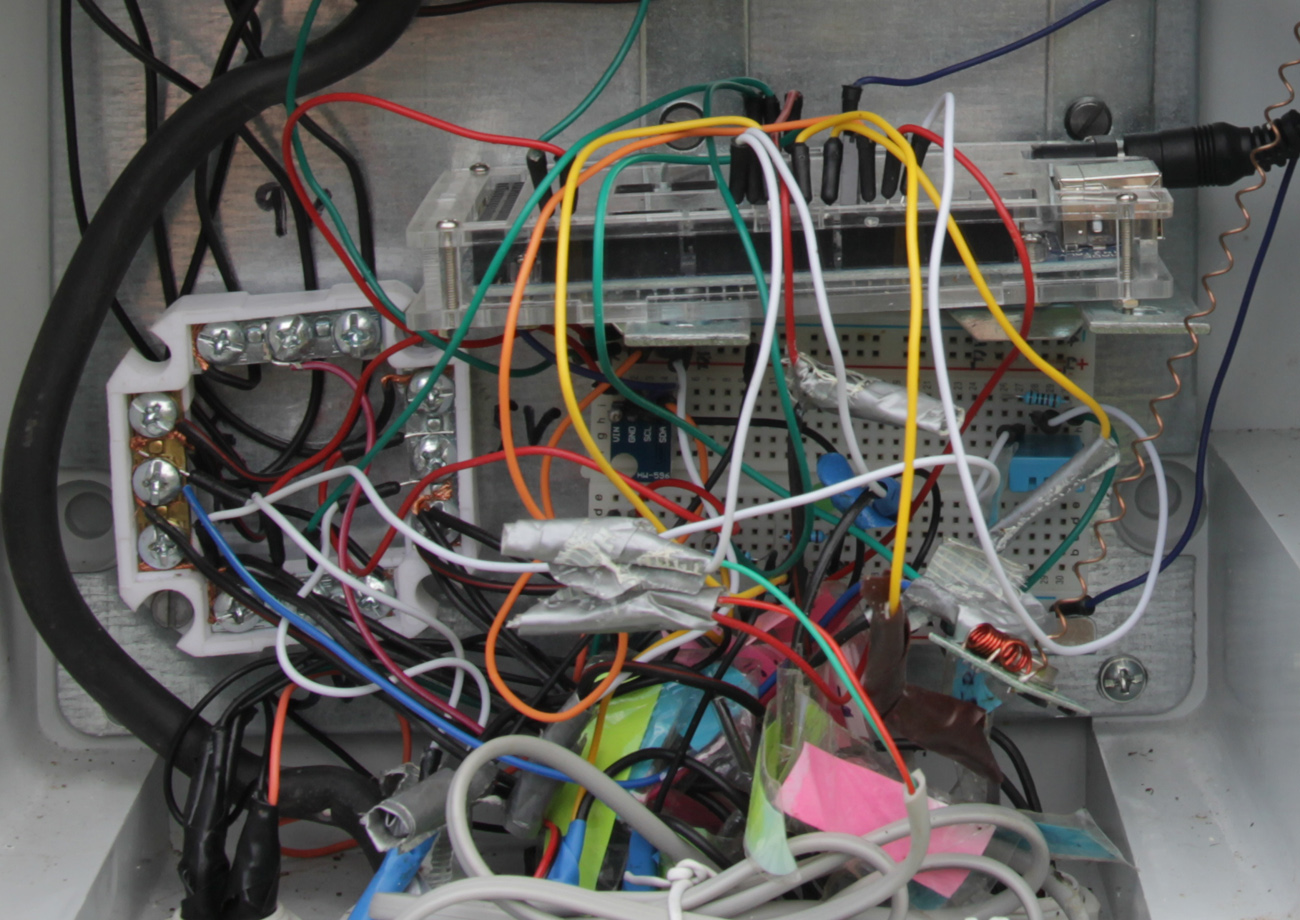
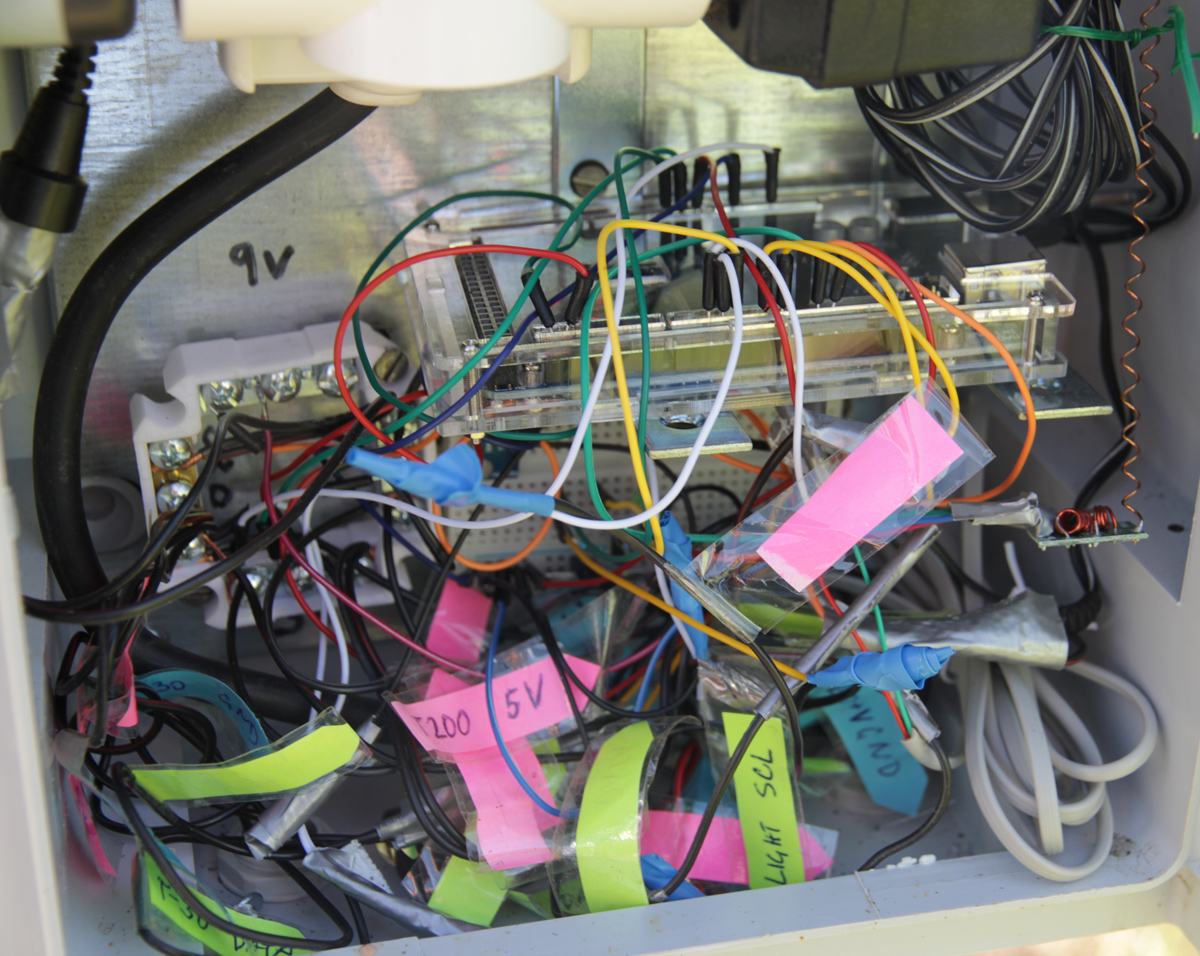
The meteostation is placed on a flat terrain, at least 10 m away from nearby buildings. The main control unit is on mounted in a box on a pillar, and the sensors are situated around this box. All parts are protected from unwanted weather influence. The location of the sensors is in accordance with meteorological rules.The temperature and humidity sensors are in covers with a fan. The station is based on the Arduino platform and uses various sensors to detect meteorological data. The sensors are connected to the Arduino unit, which collects data from the sensors and the data are then transmitted wirelessly to a second unit, which passes them to a PC. In PC the transmitted data are processed and visualised. Outputs (graphs, tables) are then uploaded to the web server of the meteo station.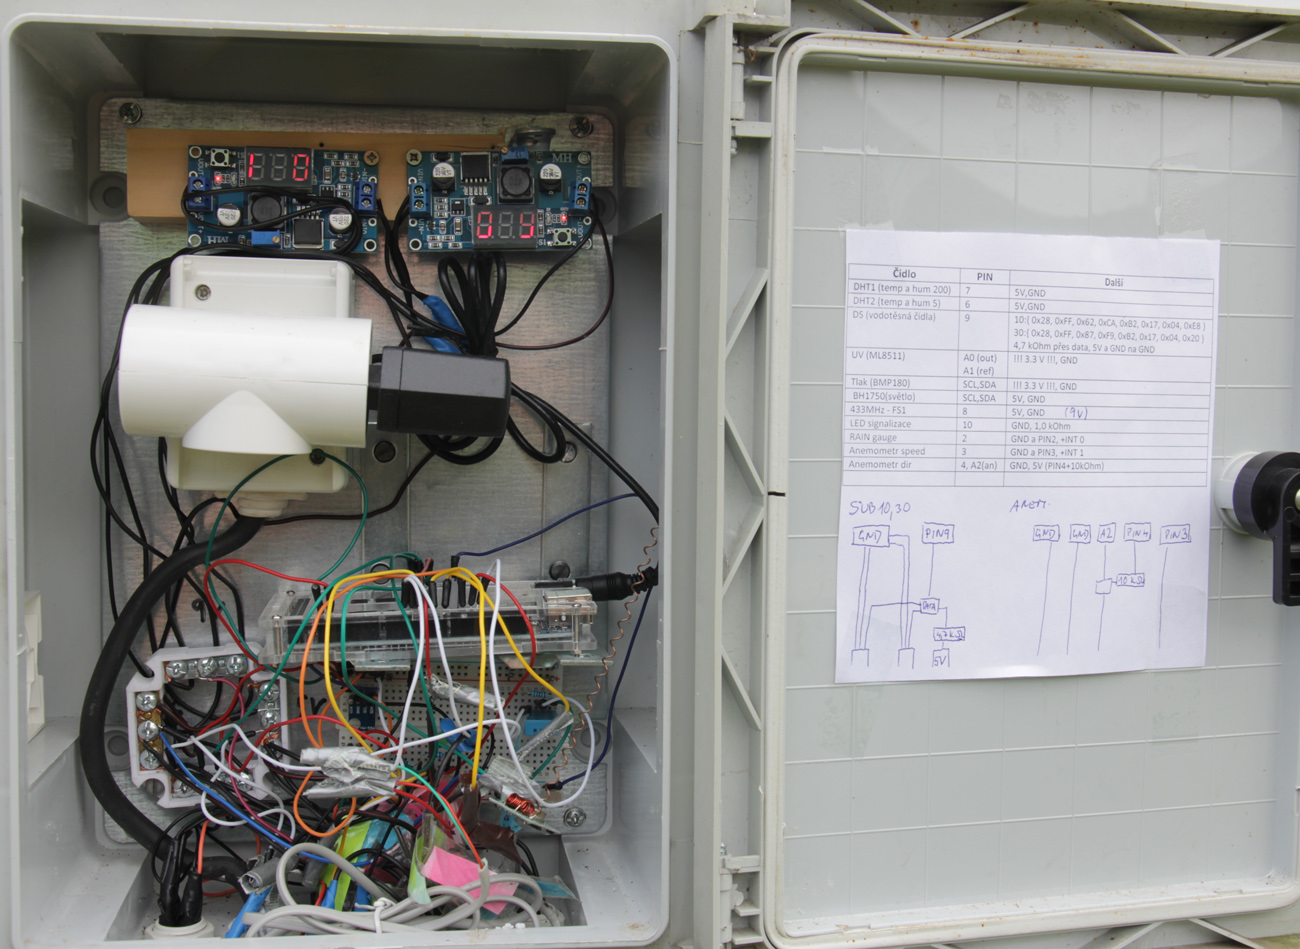
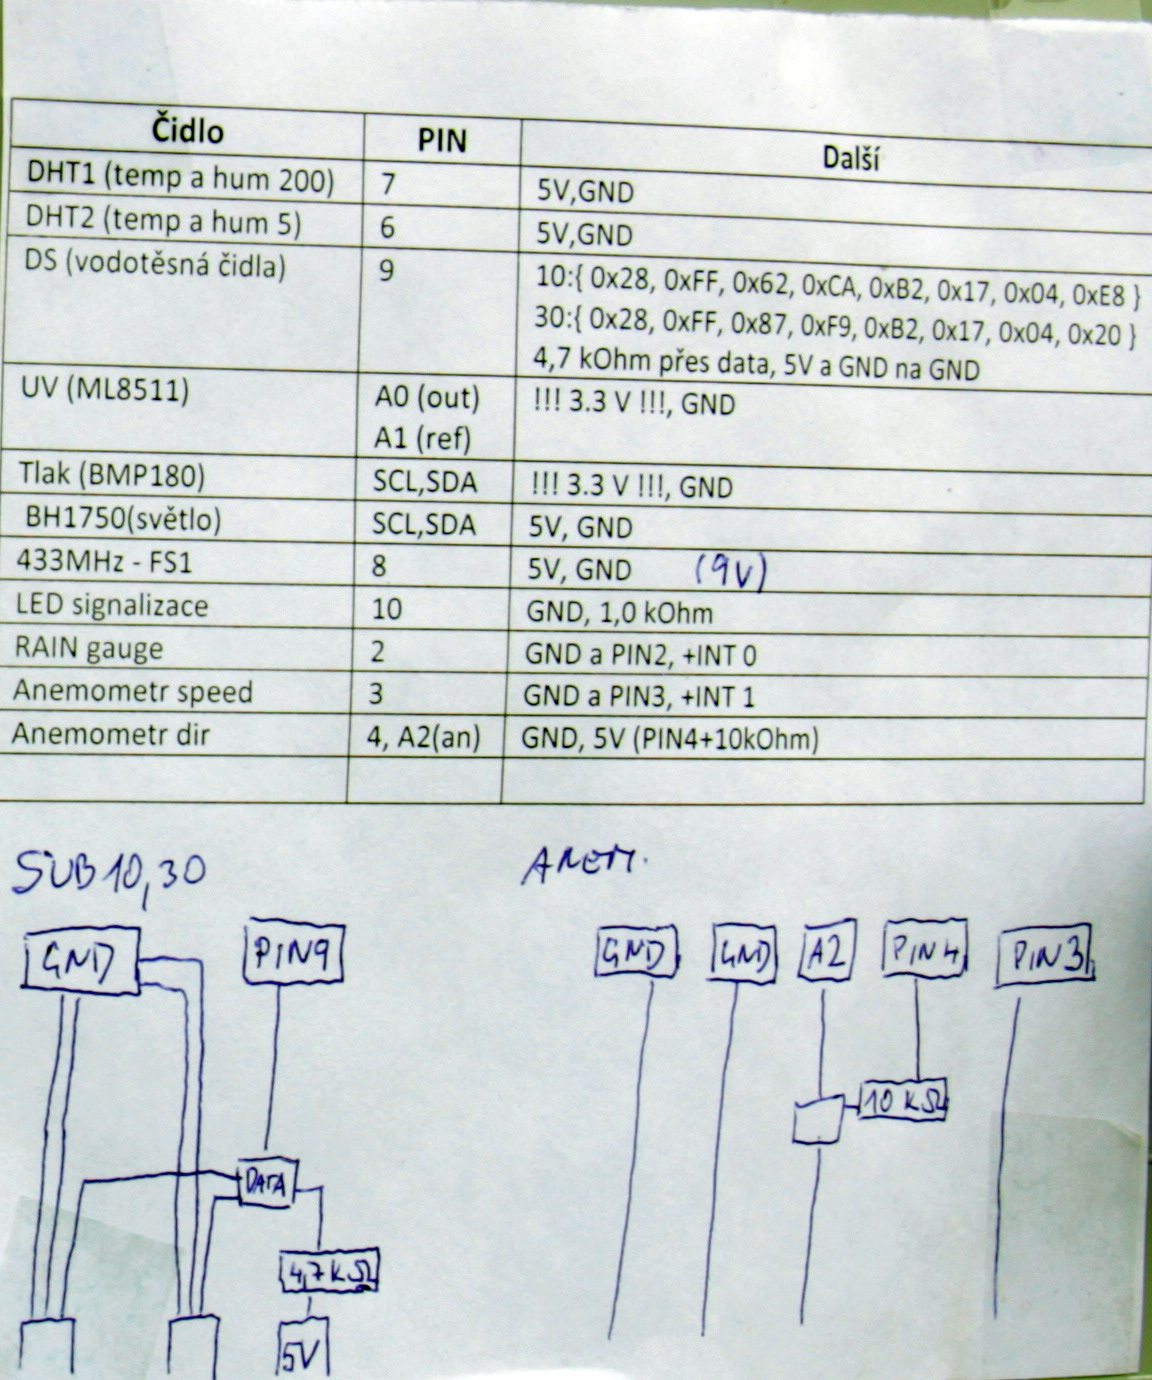

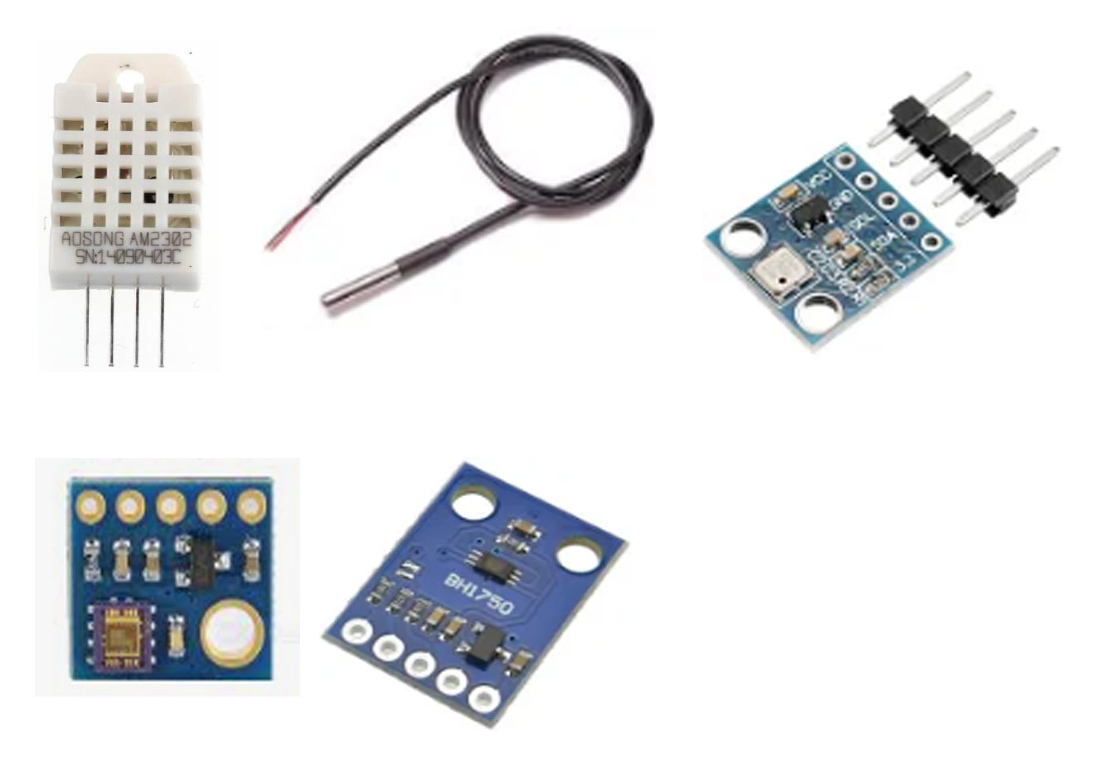
Measured data:

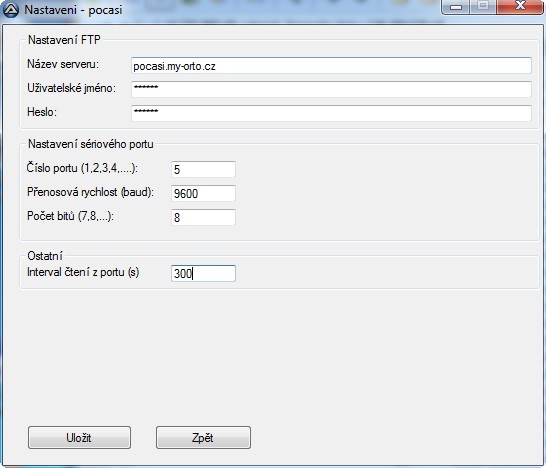
Software for data transfer and visualisation:
Standard Arduino IDE tool was used for pragramming of the rduino devices. Teh outer unit collects data, checks them and builds a message, which is then transmitted wirelessly (433 MHz) to the second unit. That one is connected to the PC via USB (simulated serial port). The programm in the computer was written in the AutoIt tool. Programm waits for incomming messages from the serial port. It checks the consistency of the data and applies corrections defined by the user, then data are visualised, graphs drawn, meteo message and html built. All is uploaded via ftp protocol to the web pages.Record values and data are saved and all the data are stored in the computer, too. Values visialised as "gauges" are uploaded immediately after each message is received, approx. in 1 minute intervals.